Power BI, M Code and Python Integration Engineering Highlights
Next-Gen Stock War Room & Quantitative Monitoring.
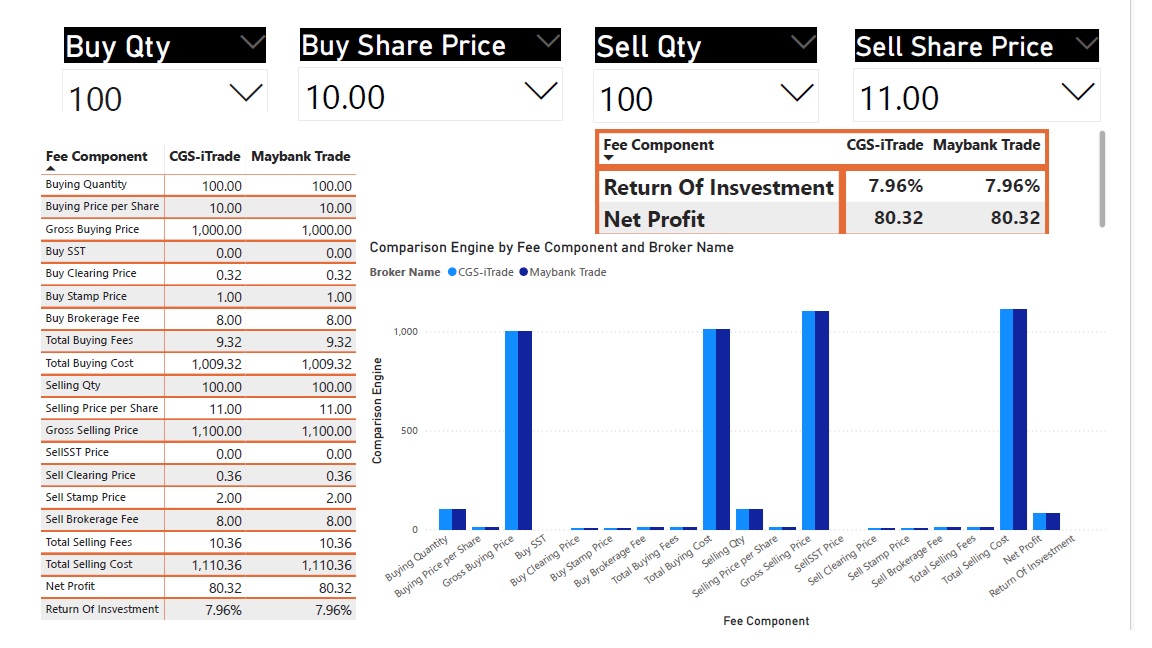
1.Major Broker Fee Comparsion Engine Using DAX Formula
Architecture: Built using Power Query (M Code) for multi-source data ingestion, normalizing disparate fee structures across global brokers.
Achievement: KPI Logic: Developed dynamic DAX measures to compare Gross vs. Net ROI, accounting for Clearing Fees, Stamp Duty, and tiered Brokerage Fees.
Feature Set: Real-time evaluation of fee components (SST, Stamp Price) to determine cost-effective execution.
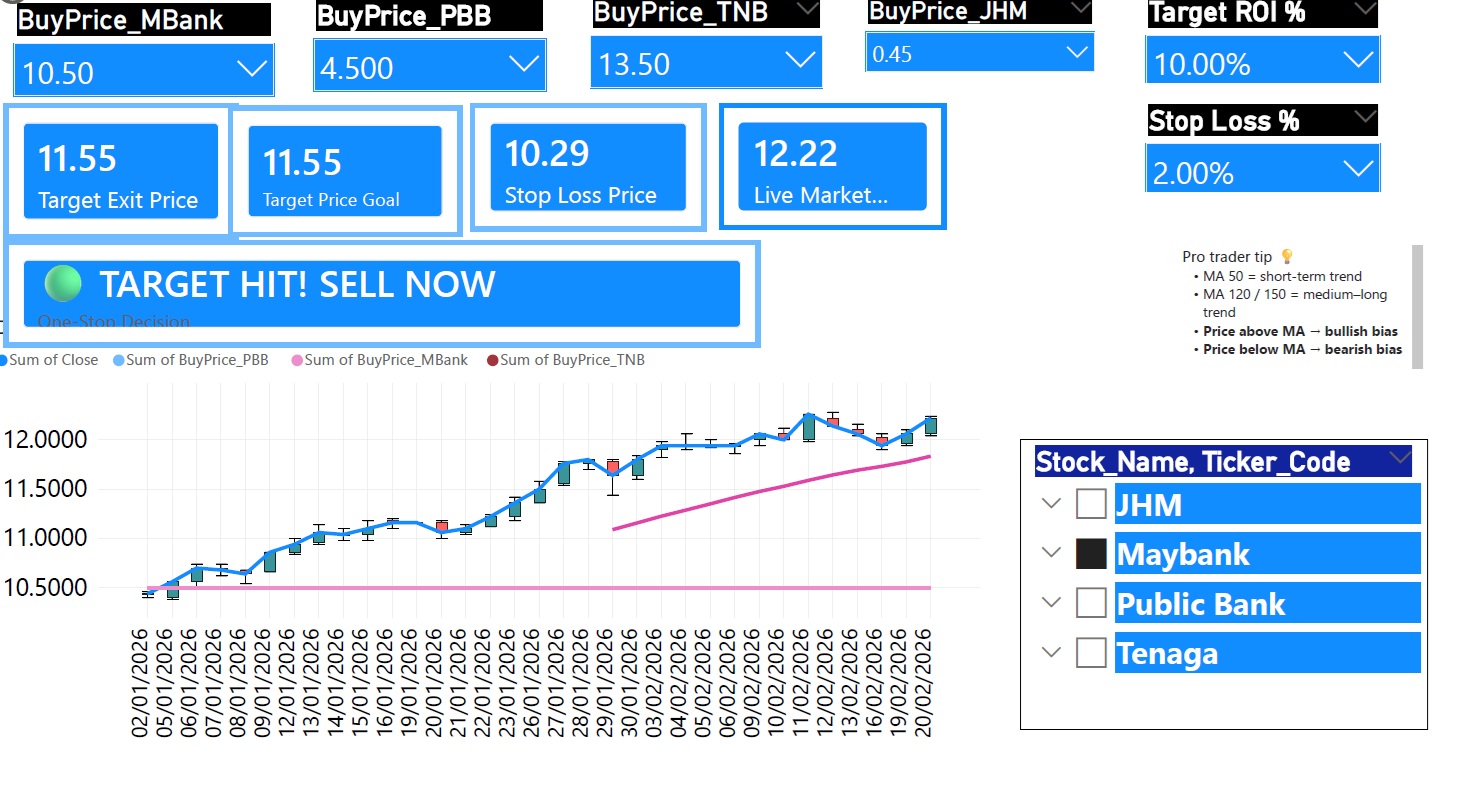
2. Advanced Risk Management: Stop Loss & Trailing Logics
Project Impact: Stop Loss Matrix: Implemented Target Exit Price and Stop Loss Price triggers using DAX to visualize states.
Achievement: Volatility-Adjusted Stops: Integrated ATR-based trailing stop loss logic via Python scripts to adapt to market volatility.
Simulation: Created an "Investment Simulator" using What-If Parameters for stress-test scenarios.
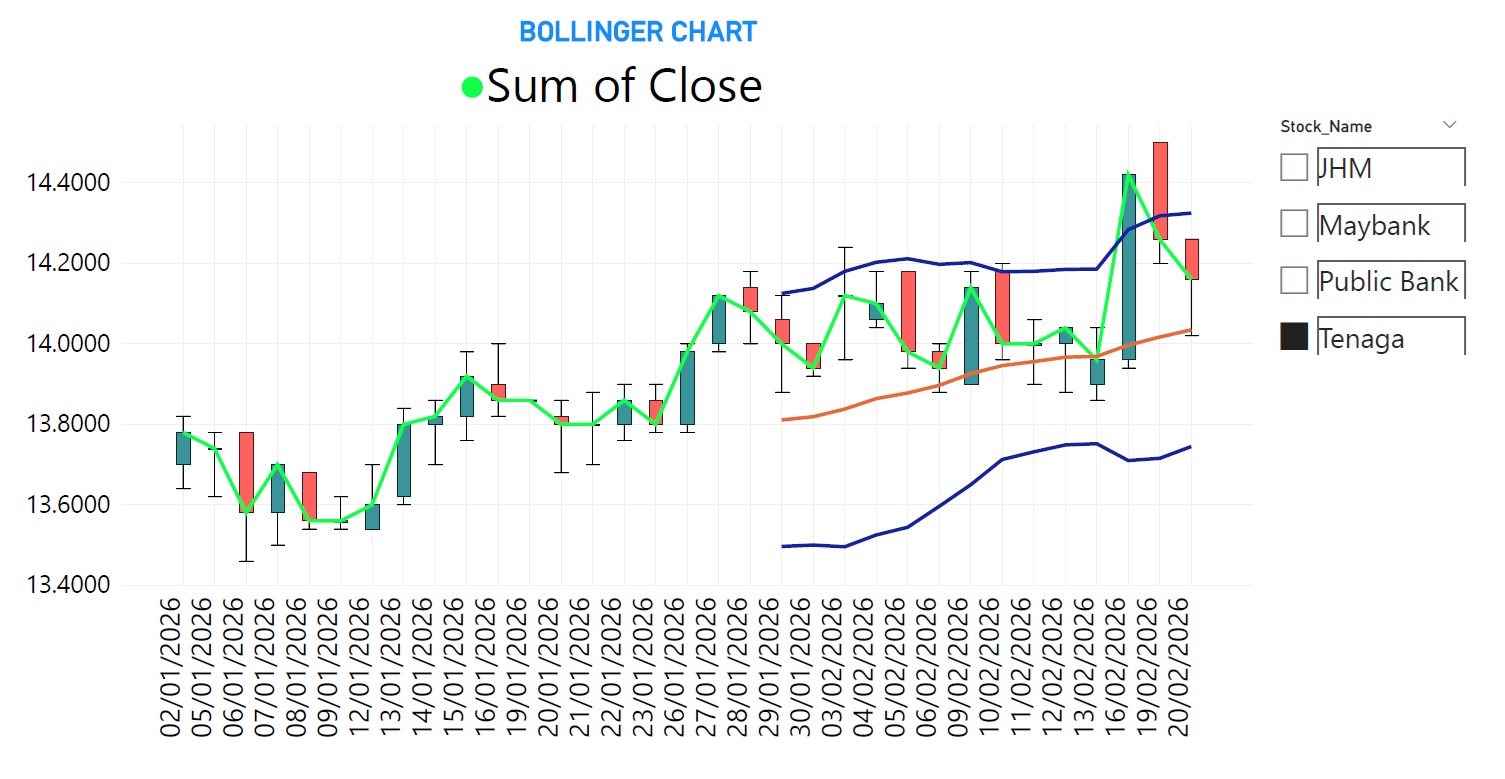
3.Bollinger Chart Development in PowerBI using DAX logics
Project Impact: SMA20,Moving Standard Deviation Price triggers using DAX to visualize states.
Achievement: Integrated SMA20 ,Upper Band and Lower Band.
Simulation: Created an "Investment Simulator" using What-If Parameters for stress-test scenarios.
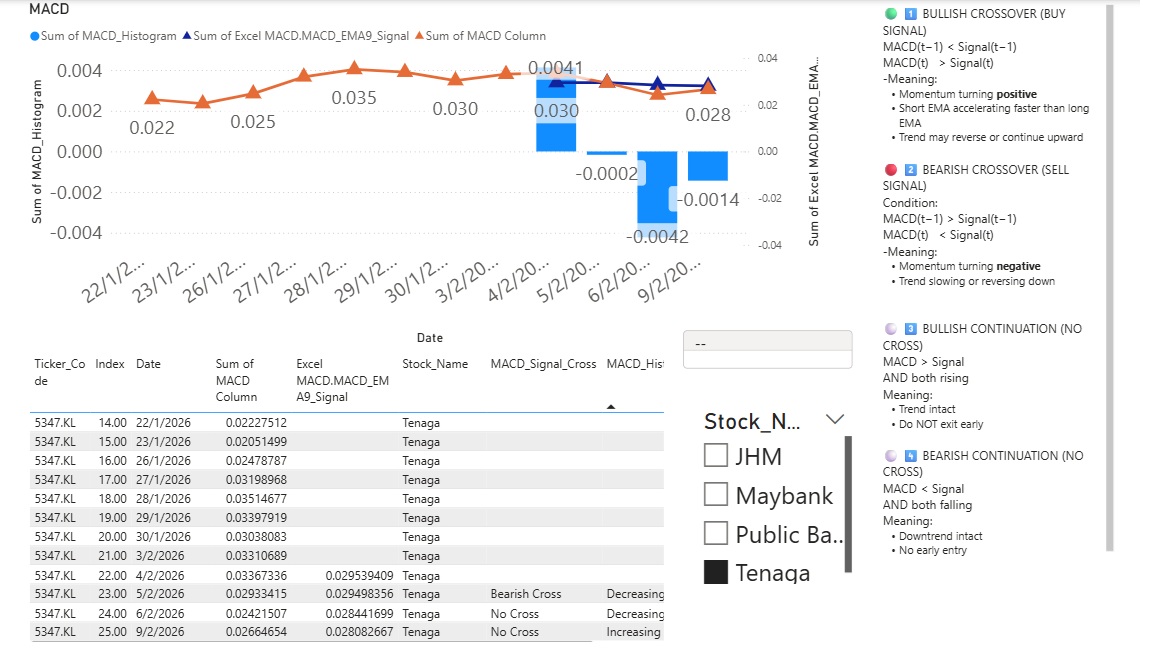
4.MACD Chart Development in PowerBI using DAX logics and Mcode Power Query
Project Impact: MACD Histogram, DIF and DEA Signal Line.
Achievement: Integrated All Meaure One Chart Technical Decision.
Simulation: Created an "Investment Simulator" using What-If Parameters for stress-test scenarios.
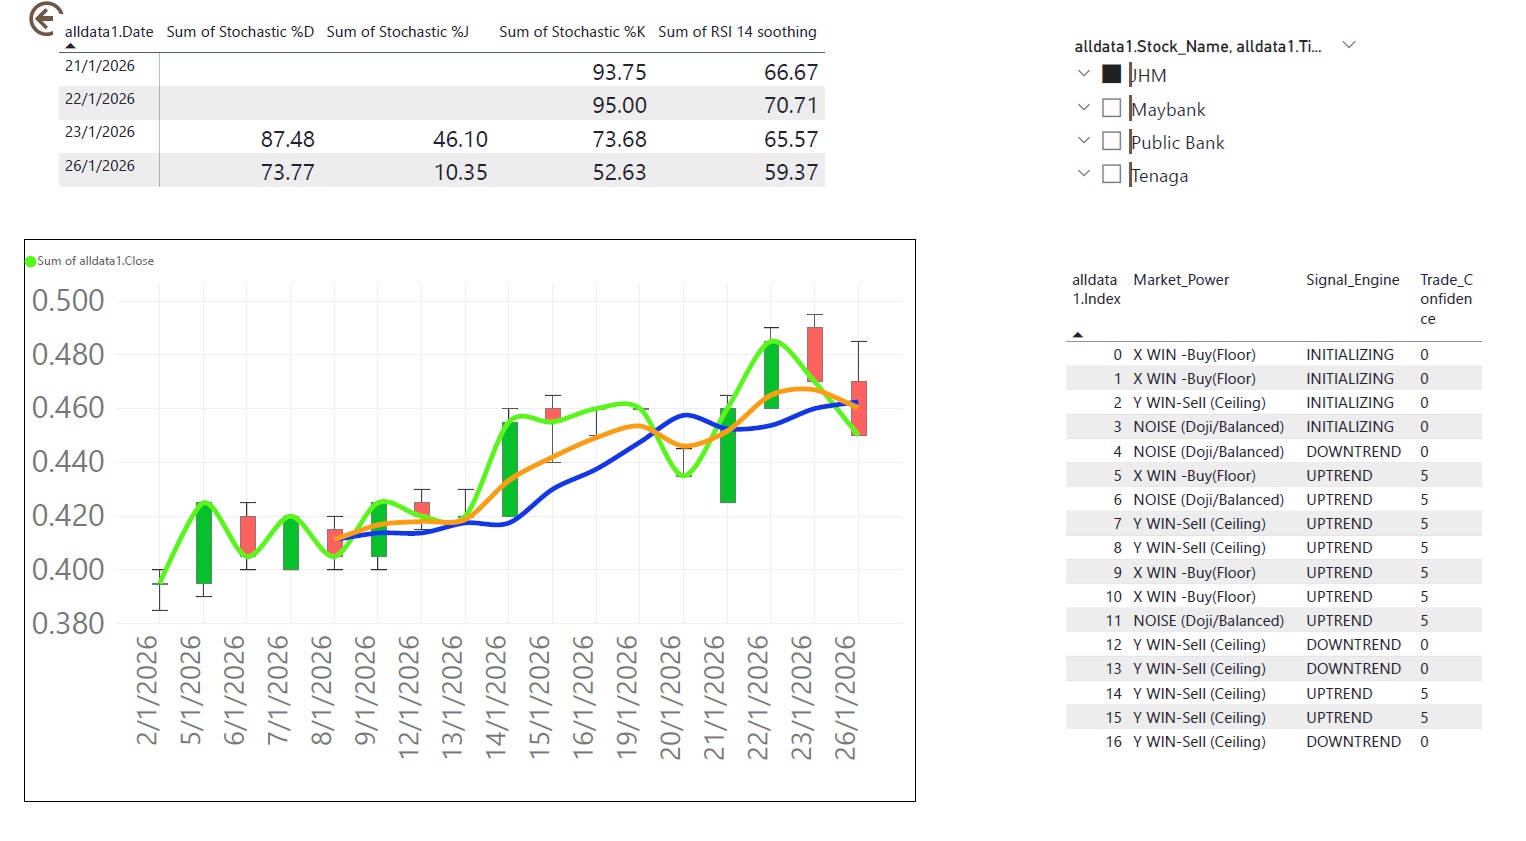
5.Techinical CandleStick Chart Usng Python Pandas and MFinance Auto Load OHLC Stock Data
Project Impact: Market Power Trend Analysis,Signal Engine,Trade Confidence Logics.
Achievement: Help User to Study the market trends to buy or sell stocks.
Simulation: Created an "Investment Simulator" using What-If Parameters for stress-test scenarios.
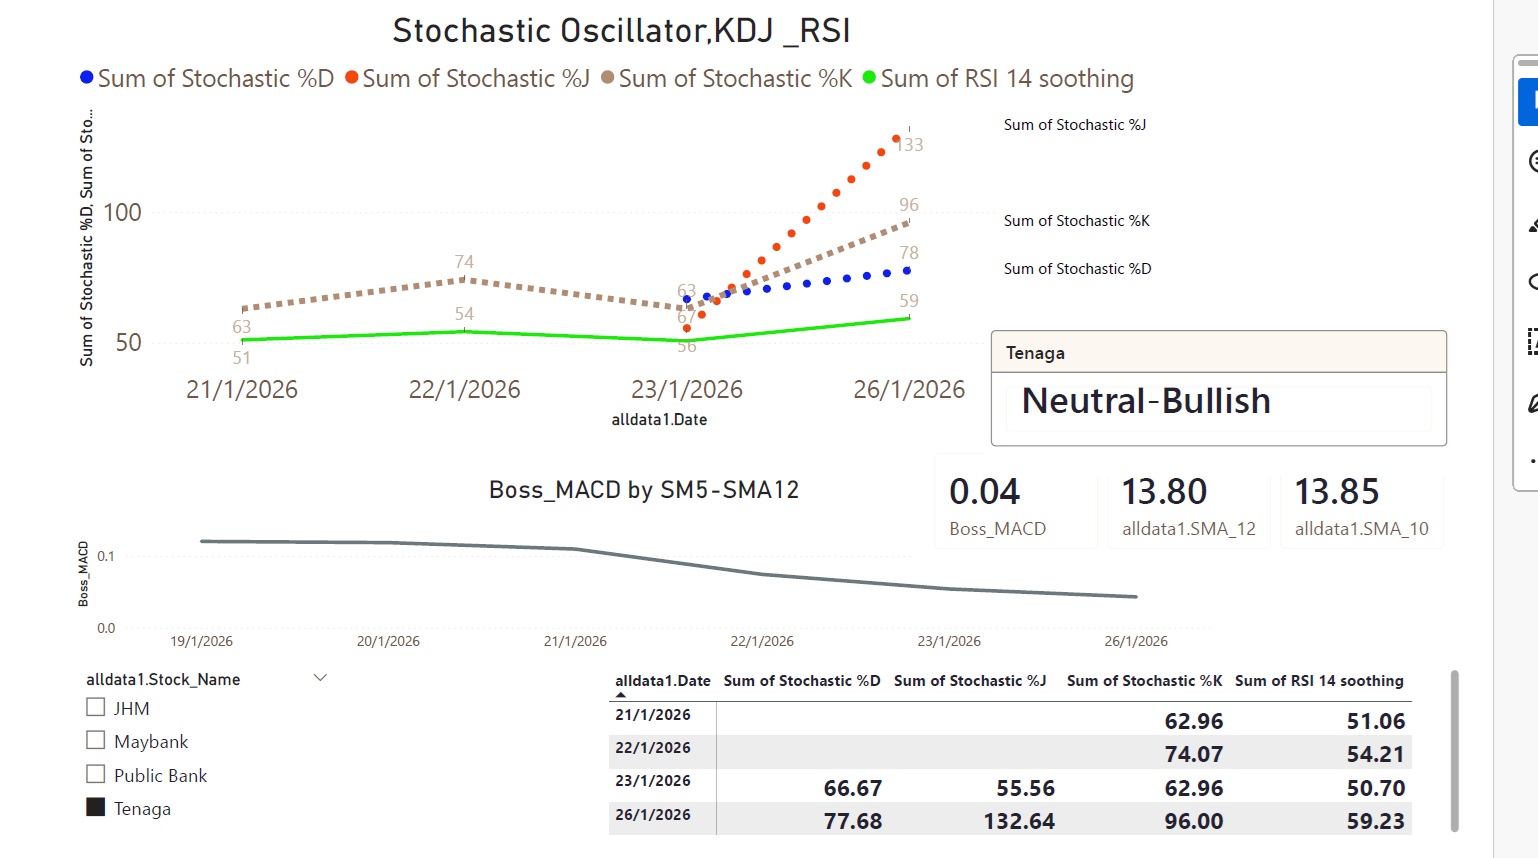
6.Stochastics Oscillators In PowerBI
Algorithmic Overlays: Automated Stochastic Stats K,D,J Developemnt crossover detection system.
Signal Precision: Leveraged Python’s pandas and numpy libraries within the Power BI
War Room Visualization: Used Power BI Analytics pane to overlay Buliish Vesrus Bearish and Neutal crossovers.